

Debunking the Lie
The Lie: Changes to TJ admissions were discriminatory against Asians
Conservative activist Asra Nomani and groups such as the Coalition 4 TJ have repeated numerous times that the changes to TJ admissions were racist against Asians. The one number being cited again and again is the percentage of Asians in the incoming class, going from 73% (Class of 2024) down to 54% (Class of 2025). That number paints a poor and misleading picture of what actually happened with Asian applicants and accepted students.
-
#1 - Asian Acceptance Rate
Between the Class of 2008 and the Class of 2024, the acceptance rate for Asian applicants ranged from 16.8% to 25.0%. For the Class of 2025, this rate was 19.48%, well within the historical range, going back 17 years. In fact, the Class of 2022 acceptance rate was lower at 19.35%, and yet there was no notable outcry then.

-
#2 - Increased Class Size
For the Class of 2025, the number of students increased from 480 to 550, a total of 70. This is an increase of nearly 15%.
Since the acceptance rate for Asian students has remained consistent, this means that for Asian students to remain at 74% of the incoming class, there needs to be a similar 15% increase of Asian applicants.
-
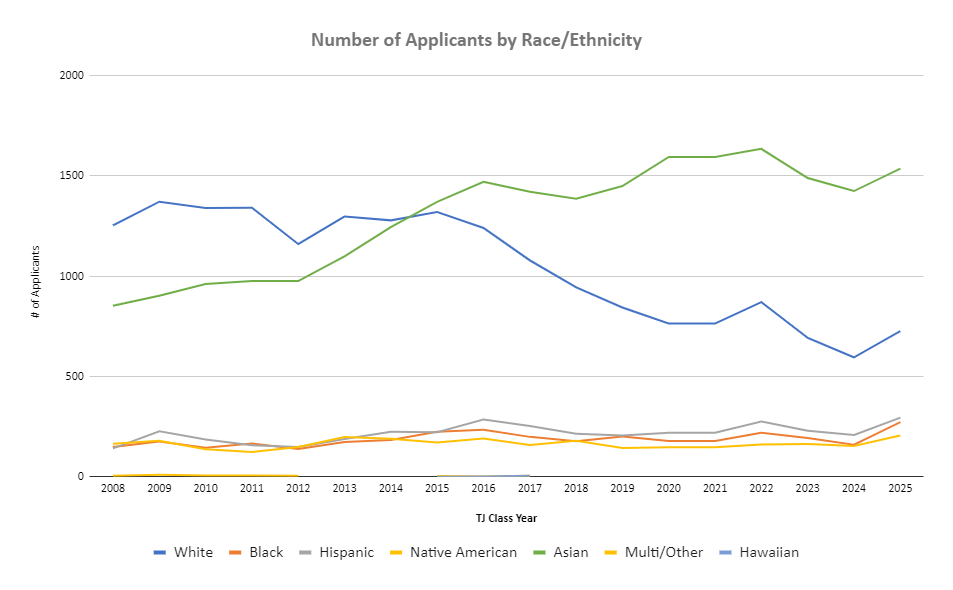
#3 - Asian Applicants Grew, But Not As Much
For the Class of 2025, there was a large increase in the number of applicants to TJ, nearly 20% in total. However, the increase for Asian applicants was modest, just under 8%. Meanwhile, the number of Hispanic applicants increased by 42%, and Black applicants by 70%.

Conclusion
The percentage of Asians making up a class year at TJ did drop, but it is not due to racial discrimination. There was a 15% increase in class size, but Asian applicants only grew by less than 8%. Since the acceptance rate for Asians remained consistent with historical levels, this discrepancy is what led to a lower percentage of Asian admittees compared to previous years.
What we are seeing with TJ admissions is called “growing the pie”. More students, across a wider racial and socioeconomic spectrum, are able to attend the school. This should not be considered a bad thing.
Additional Information
-
Myth #1 - The Asian proportion at TJ has always been above 70%, so it's surprising that it's so low
Asians making up more than 70% of the incoming class has been a fairly recent phenomenon, going back the last 7 out of 17 years of data. Prior to the Class of 2016, Asians regularly represented less than 60% of the incoming class.
For context, Asians make up 19.8% of FCPS students. (Source)

-
Myth #2 - Black and Hispanic students are being given an unfair advantage
It is a myth that Black and Hispanic students have an unfairly higher acceptance rate than other groups. Prior to the Class of 2025, the acceptance rate for Black and Hispanic applicants was consistently under 10%. With the recent admissions changes, the acceptance rate grew to 14% and 21% respectively. This is much more in-line with the acceptance rate for applicants of other races.

-
Myth #3 - The admissions process uses race as a factor to decide who gets into TJ
The TJ admissions process is race-neutral.
There are experience factors that are socio-economic in nature. Additionally, students from underrepresented schools are given a higher bonus score. None of these factors explicitly use race.
It is also a myth that Asians are a “model minority” and all come from high socio-economic backgrounds. There are many Asians who stand to benefit from the TJ admissions changes.

-
Myth #4 - The number of TJ applicants has been steadily growing
A few years prior to the admissions changes, there was actually a substantial drop in applicants to TJ. For the Class of 2022, there were 3,160 applicants. For the Class of 2023, there were 2,766 applicants, a decline of 12%. For the Class of 2024, there were 2,539, a further drop of 8%. In total, there was a nearly 20% reduction in TJ applicants in just two years.
The recent admissions changes were a bit of a reset. With the removal of the application fee and the standardized test, the number of applicants surged in all demographic groups, with larger increases in groups with lower acceptance rates historically (i.e., girls, economically disadvantaged, Black, and Hispanic/Latinx students). TJAAG supports having more students apply to TJ, instead of fewer.
-
Myth #5 - The TJ admissions changes affected male and female applicants equally
While the number of applicants rose dramatically across the board, it was more pronounced for female applicants compared to male applicants. Male applicants rose nearly 13%, but female applicants more than doubled that rate, increasing by 27.5%.
With studies showing that standardized tests are unfair to girls, it is not surprising that admissions reforms that removed barriers encouraged more girls to apply to TJ.

-
Myth #6 - Favoring the economically disadvantaged only helped Black and Hispanic/Latinx students
It is a myth that Asians are a “model minority” and that all Asians have a high level of economic success.
Due to the admissions changes, there was a large increase of enrolled FCPS 9th graders considered economically disadvantaged. For the Class of 2024, there were less than 10 in this category. For the Class of 2025, there were 111 students. Asians represent the largest racial group, at 38 students, 34% of the total.
TS = less than 10, exact number too small to report for privacy concerns

-
Myth #7 - The greatest impact of the admissions changes was on the racial make-up of the incoming class
The greatest impact of the admissions changes was not on the racial make-up of the incoming class, but on the number of students with certain socioeconomic experience factors (as designed). While there was a decrease of 25 in the total number of Asian FCPS 9th graders enrolled from the Class of 2024 to the Class of 2025, there was an increase of over 100 economically disadvantaged students (with at least 30 of those being Asian, see data under Myth #6).
